Mostrando entradas con la etiqueta silver. Mostrar todas las entradas

18.2.18

Gold And Silver's Place In An ETF Portfolio

Summary
  • GLD and SLV prices are at their lowest since May. Now may be a good time to consider diversifying your ETF portfolio to include precious metals.
  • Gold and silver can be volatile in the short and mid-term, but over long periods of time, they are a protection against inflation and geopolitical risk.
  • Diversifying 5% of your ETF portfolio in gold and silver gives exposure with reduced costs and increased liquidity.
Along with the election of Donald Trump as the 45th President of the United states came uncertainty in the immediate future of inflationary assets. As the markets begin to react for the longer term, U.S. bond yields were set to a 15-year high on Friday. Markets seem to be increasingly expecting a December increase of Fed interest rates and investors are beginning to price them in. We're also seeing interest rate expectations help boost financial sector stocks. The dollar is strengthening and, simultaneously, indexes are setting record highs. Markets are mostly reacting positively, but what if the experts are wrong? There are still a lot of uncertainties swimming around President-elect Trump's policy proposals. Along with those uncertainties come further blurring of winners and losers of Trump administration policies. Prior to the election, markets were reacting highly negatively to the prospects of a Trump presidency. After his surprise upset, markets reacted the opposite way to the same news. The fact of the matter is nobody knows for certain the impact Trump's policies will have on the nation's publicly-traded companies. The picture appears to be getting somewhat clearer as appointments become more public; however, financial markets, the media, and academia all failed to predict Trump's surprise victory to begin with, so, now is the perfect time to hedge bets in your ETF portfolio with a historically well-known store of value and protector of wealth - gold.
Why an ETF Portfolio?
Advertisement
With the growth of ETFs over the last half decade, constructing a highly-diverse investment portfolio with only a handful of low-cost exchange-traded securities has not only become a possibility, but also a growing reality. I've previously discussed a group of 6 ETFs that provide you a low cost well-diversified portfolio, which provides exposure to U.S. & emerging market equities, real estate, and bonds. Protecting your market-based assets through diversification can help you avoid the shortfalls of picking winners and losers and greatly reduce the risks of your holdings.
Gold and Silver's Place in An ETF Portfolio
Strong equities markets tend not to be very good for gold, but gold has historically been seen as a hedge against uncertainty. If you look back at 2013-2015, there wasn't much volatility in the marketplace. In January & February of 2016, volatility increased, and gold prices rose, as it once again was seen as safe haven. Silver has been seen as gold's little brother. It moves similarly to gold, generally speaking; however, its price can be more affected by demand for industrial use than gold. It has a precious metal aspect to it along with some of the features of other metals. Currency devaluation in countries likeChina and India are likely to boost demand for gold and silver globally. Geopolitical tensions drive up demand, and President Trump is suggesting he will shake things up in Washington. There are plenty of other reasons you'd want to allocate part of your assets into precious metals. Gold and silver have been a great store of value - perhaps, the most historically prominent store of wealth in world history.
(click to enlarge)
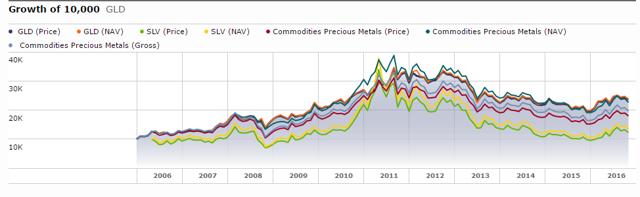
Gold has a historically low to negative correlation with most broad asset classes. Allocating just 5% of our assets into two precious metal ETFs gives us exposure to the historical upside associated with gold and silver during times of geopolitical uncertainty by reducing our bond and real estate exposure. If your portfolio is more aggressive, you can consider allocating a bit more into silver, which has the added upside potential of an increase in global manufacturing of electronic devices. Below is a chart on how we can expand our six-ETF portfolio to add gold to our portfolios.
(click to enlarge)
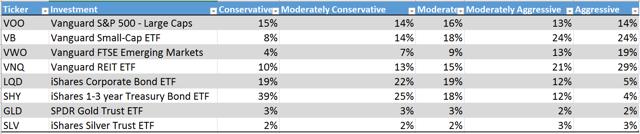
The SPDR Gold Trust ETF (NYSEARCA:GLD) offers a low expense ratio of 0.4% and an average volume of well over 10 million shares traded per day. For the last 10 years, GLD has returned an annualized average of 6.17%, totaling 81.95%. GLD set its 10-year high in 2011 at $184.59, a long way off its current trading price of $113.67. Gold can rally and retreat based upon current events, but returns are more stable in the long term. As far as investing in physical gold trusts, GLD is one of the most popular gold trusts. Year to date, gold has rallied after posting negative returns for the prior 3 years. GLD is trading at its lowest price since January, so now is as good of a time as ever to start diversifying an ETF portfolio into gold assets.
(click to enlarge)
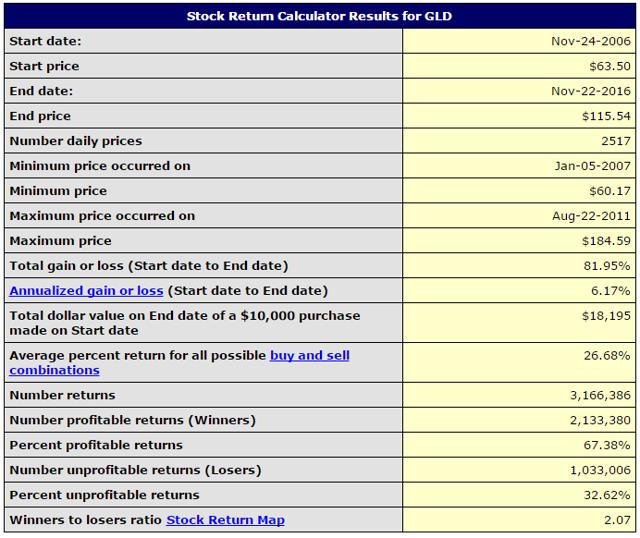
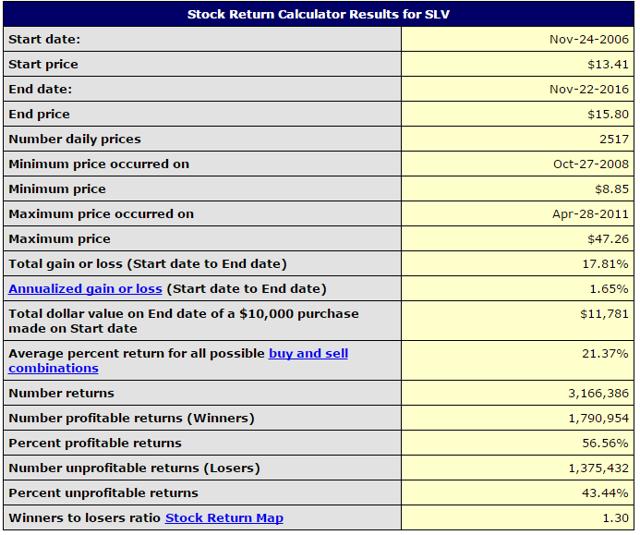
The iShares Silver Trust ETF (NYSEARCA:SLV) gives you exposure to silver with a slightly higher expense ratio of .05%. Silver is more volatile than gold, but its historical value as a money and store of wealth, coupled with its industrial uses, provide two separate avenues for growth as well as volatility. The ETF portfolio above allocates between 2-3% of holdings in silver. Over the last 10 years, SLV has demonstrated more volatility than gold. One great long-term opportunity for silver lies in its industrial use. Almost all electronics contain some silver. Its excellent electrical conductivity makes it the natural choice of electronics manufacturers for use in things like circuit boards, switches, televisions, smartphones and tablets. Over the last decade, silver has been on a wild ride which is why you should only expose a small portion of your portfolio in silver assets. Over the last ten years, silver has returned an average of 3.41% annually. It's historically been known as a store of value, and there are definitely upside opportunities for silver in the future. The volatility in the short and mid-term can put a dent in your portfolio, however. Therefore, silver is really a long-term play for those patient enough to live through the volatility and sell when markets permit profit taking. SLV is at its lowest levels since May. Putting aside 2-3% of your portfolio into silver with a 10-year long-term projection adds exposure to silver along with your new gold position. You may even be able to take profits during rallies.
10-Year Annualized Return on SLV
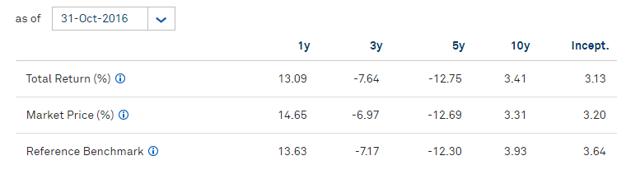
SLV Returns

The Bottom Line
Gold and silver have historically been seen as money and a store of value. Relative to U.S. currency, gold and silver see increases in prices during times of instability in financial markets and fiat currencies. As a result, the risks associated with potential for political uncertainty stemming from a new U.S. Executive Administration can be hedged by adding two small positions of GLD and SLV to our portfolio. Over a lifetime, fewer assets have the tangible store of value and wealth protection. By adding 5% to our portfolio of ETFs, we are limiting our downside risks, while still taking advantage of long-term opportunities in gold and silver. Of course, you could buy physical gold and silver, but buying GLD and SLV is easier to initiate a position in as well as manage going forward. Silver can be bulky and gold can be difficult to sell locally. Storage and protection costs must be accounted for as well. GLD and SLV do a great job of tracking gold and silver and have a place in any long-term driven portfolio of well-diversified assets.
Disclosure: I/we have no positions in any stocks mentioned, and no plans to initiate any positions within the next 72 hours.
I wrote this article myself, and it expresses my own opinions. I am not receiving compensation for it (other than from Seeking Alpha). I have no business relationship with any company whose stock is mentioned in this article.

16.12.17

Staggering e-waste numbers revealed in grim new report


Last year, we “smart” humans threw away 44.7 million metric tonnes of things with a plug or battery – everything from refrigerators and television sets to solar panels and mobile phones. To put that in more visual terms, imagine 1.23 million 18-wheel trucks filled to capacity with e-waste – enough trucks to line up bumper-to-bumper from New York to Bangkok and back. (A metric tonne is equal to around 1.1 US tons, or about 2,204 pounds.)

Given that we generated 8 percent more than we did just two years prior, things aren’t looking very good. And in fact, according to a new UN-backed report, we can expect to see a further 17 percent increase of e-waste, to 52.2 million metric tonnes, by 2021. E-waste is the fastest growing part of the world's domestic waste stream.


The new report, Global E-waste Monitor 2017 is a group effort between the United Nations University (UNU), represented through its Sustainable Cycles (SCYCLE) Programme hosted by UNU's Vice-Rectorate in Europe, the International Telecommunication Union (ITU), and the International Solid Waste Association (ISWA). The basic gist is that falling prices have made electronics affordable for most people worldwide; meanwhile, people in wealthier countries are being increasingly lured to buy early equipment replacement or new things altogether.

Here’s how it looks by the numbers:

9: The number of great pyramids that are equal in weight to the amount of e-waste generated last year.

20 percent: The amount of that e-waste that was recycled in 2016.

4 percent: The amount of 2016 e-waste known to have been thrown into landfills.

76 percent: The amount of 2016 e-waste that was incinerated, in landfills, recycled in informal (backyard) operations or remains stored in our households.

$55,000,000,000: The value of gold, silver, copper, other high value recoverable materials that were not recovered.


6.1 kilograms (13.4 pounds): The average amount of e-waste generated globally per person in 2016.

11.6 kilograms (25.5 pounds): The average amount of e-waste generated in the Americas per person in 2016.

17 percent: The amount of e-waste recycled in the Americas in 2016.

3: The number of electrical and electronic equipment categories that account for 75 percent of global e-waste by weight, and also expected to see the most growth:

Small equipment, like vacuum cleaners, microwaves, ventilation equipment, toasters, electric kettles, electric shavers, scales, calculators, radio sets, video cameras, electrical and electronic toys, small electrical and electronic tools, small medical devices, small monitoring and control instruments.Large equipment, like washing machines, clothes dryers, dish-washing machines, electric stoves, large printing machines, copying equipment, photovoltaic panels).Temperature exchange equipment, like refrigerators, freezers, air conditioners, heat pumps.


7.4 billion: The world population.

7.7 billion: The number of mobile-cellular subscriptions.

36 percent: The number of Americans who own a smartphone, a computer, and a tablet.

2 years: The far end of an average smartphone lifecycle in the USA, China, and major EU countries.

1 million tons: The weight of all the chargers for mobile phones, laptops et cetera, produced each year.


If there's a bright side to this dark mess, it's that more countries are adopting e-waste legislation, the report says, noting that 66 percent of the world's people live in the countries that have national e-waste management laws; an increase of 44 percent since 2014.

Also, although we’re making more and more stuff, some of it is getting smaller. Waste for small IT and telecommunication equipment (mobile phones, GPS, pocket calculators, routers, personal computers, printers, telephones, et cetera) is expected to grow less quickly by weight due to miniaturization.

Likewise, little growth is expected for lamps (fluorescent lamps, high intensity discharge lamps, LED lamps). And as heavy CRT screens for televisions, monitors, laptops, notebooks, and tablets are replaced with flat panel displays, e-waste from this category is expected to decline.

Just as Tom Waits sings, “you can never hold back spring,” so too can we not hold back digital progress. But we most certainly can make an effort to better design components used in electrical and electronic equipment, as well as devise better methods for recycling and recovering. All of which this report calls for.

"We live in a time of transition to a more digital world, where automation, sensors and artificial intelligence are transforming all the industries, our daily lives and our societies,” says Antonis Mavropoulos, President, International Solid Waste Association (ISW). “E-waste is the most emblematic by-product of this transition and everything shows that it will continue to grow at unprecedented rates. Finding the proper solutions for e-waste management is a measure of our ability to utilise the technological advances to stimulate a wasteless future and to make circular economy a reality for this complex waste stream that contains valuable resources. But first, we need to be able to measure and collect data and statistics on e-waste, locally and globally, in a uniform way. The Global E-Waste Monitor 2017 represents a significant effort in the right direction."

And of course, on a consumer level we can fight the cause of the problem: We can treat our equipment as if it were precious, not disposable. We can resist the siren song of shiny new things, take care of what we have, repair when we can and donate when we can't ... and when all else fails, recycle responsibly.

6.5.17

Overview of E-waste Recycling Market in Global Industry : Technology, Applications, Growth and Status 2017

ResearchMoz presents professional and in-depth study of "Global E-waste Recycling Market Research Report 2017".

In this report, the global E-waste Recycling market is valued at USD XX million in 2016 and is expected to reach USD XX million by the end of 2022, growing at a CAGR of XX% between 2016 and 2022.

Geographically, this report is segmented into several key Regions, with production, consumption, revenue (million USD), market share and growth rate of E-waste Recycling in these regions, from 2012 to 2022 (forecast), covering
United States
EU
China
Japan
South Korea
Taiwan

Global E-waste Recycling market competition by top manufacturers, with production, price, revenue (value) and market share for each manufacturer; the top players including
SIMS RECYCLING SOLUTION
Stena Techno World
Kuusakoski
Umicore
environCom
WASTE MANAGEMENT
Eletronic Recyclers International
GEEP
CIMELIA Resource Recovery
Veolia
Gem
Dongjiang

On the basis of product, this report displays the production, revenue, price, market share and growth rate of each type, primarily split into
Infocomm Technology (ICT) Equipment
Home Appliances

Get PDF for more Professional and Technical insights @ http://www.researchmoz.us/enquiry.php?type=S&repid=1048945

On the basis on the end users/applications, this report focuses on the status and outlook for major applications/end users, consumption (sales), market share and growth rate of E-waste Recycling for each application, including
Enterprise
Government
ENGO

Table of Contents

2 Global E-waste Recycling Market Competition by Manufacturers
2.1 Global E-waste Recycling Capacity, Production and Share by Manufacturers (2012-2017)
2.1.1 Global E-waste Recycling Capacity and Share by Manufacturers (2012-2017)
2.1.2 Global E-waste Recycling Production and Share by Manufacturers (2012-2017)
2.2 Global E-waste Recycling Revenue and Share by Manufacturers (2012-2017)
2.3 Global E-waste Recycling Average Price by Manufacturers (2012-2017)
2.4 Manufacturers E-waste Recycling Manufacturing Base Distribution, Sales Area and Product Type
2.5 E-waste Recycling Market Competitive Situation and Trends
2.5.1 E-waste Recycling Market Concentration Rate
2.5.2 E-waste Recycling Market Share of Top 3 and Top 5 Manufacturers
2.5.3 Mergers & Acquisitions, Expansion

3 Global E-waste Recycling Capacity, Production, Revenue (Value) by Region (2012-2017)
3.1 Global E-waste Recycling Capacity and Market Share by Region (2012-2017)
3.2 Global E-waste Recycling Production and Market Share by Region (2012-2017)
3.3 Global E-waste Recycling Revenue (Value) and Market Share by Region (2012-2017)
3.4 Global E-waste Recycling Capacity, Production, Revenue, Price and Gross Margin (2012-2017)
3.5 United States E-waste Recycling Capacity, Production, Revenue, Price and Gross Margin (2012-2017)
3.6 EU E-waste Recycling Capacity, Production, Revenue, Price and Gross Margin (2012-2017)
3.7 China E-waste Recycling Capacity, Production, Revenue, Price and Gross Margin (2012-2017)
3.8 Japan E-waste Recycling Capacity, Production, Revenue, Price and Gross Margin (2012-2017)
3.9 South Korea E-waste Recycling Capacity, Production, Revenue, Price and Gross Margin (2012-2017)
3.10 Taiwan E-waste Recycling Capacity, Production, Revenue, Price and Gross Margin (2012-2017)

Make an Enquiry of this report @ http://www.researchmoz.us/enquiry.php?type=E&repid=1048945

4 Global E-waste Recycling Supply (Production), Consumption, Export, Import by Region (2012-2017)
4.1 Global E-waste Recycling Consumption by Region (2012-2017)
4.2 United States E-waste Recycling Production, Consumption, Export, Import (2012-2017)
4.3 EU E-waste Recycling Production, Consumption, Export, Import (2012-2017)
4.4 China E-waste Recycling Production, Consumption, Export, Import (2012-2017)
4.5 Japan E-waste Recycling Production, Consumption, Export, Import (2012-2017)
4.6 South Korea E-waste Recycling Production, Consumption, Export, Import (2012-2017)
4.7 Taiwan E-waste Recycling Production, Consumption, Export, Import (2012-2017)